Remote debugging
Remote debugging
It might be necessary to use a remote debugger to step through code execution on the cluster, where log analysis does not provide sufficient information to resolve an issue. The following is an outline of the steps required to connect eclipse’s remote debugger to the Merative Social Program Management (SPM) code running on the cluster.
- Edit the Cúram producer deployment spec to pass debug arguments to the WebSphere® Liberty server.
- Forward the debugging port from the port running the Cúram producer pod.
- Create the remote debug configuration in eclipse.
- Connect the remote debugger to the listener.
These steps are explained in more detail below.
Edit the Cúram producer deployment
Edit the deployment spec for the Cúram producer deployment.
kubectl edit deployment release-apps-curam-producer
Add the following lines under .spec.template.spec.containers:
containers:- args:- /opt/ibm/wlp/bin/server- debug- defaultServerenv:......
containers:- args:- /opt/ibm/wlp/bin/server- debug- defaultServer- env:......
Upon saving your deployment setting changes the Cúram producer deployment will terminate its pod and start a new one with the debug configuration.
Forward the debugging port
Once the restarted pod has completed initialization and started the Libery server kubectl logs command will indicate that the Liberty server is waiting on the debug port:
Listening for transport dt_socket at address: 7777
At this point forward the WebSphere® Liberty server’s debug port to make it available to the remote debugger. 7777 is the default debug port for WebSphere® Liberty.
kubectl port-forward release-apps-curam-producer-XXXX 7777:7777
Create the remote debug configuration
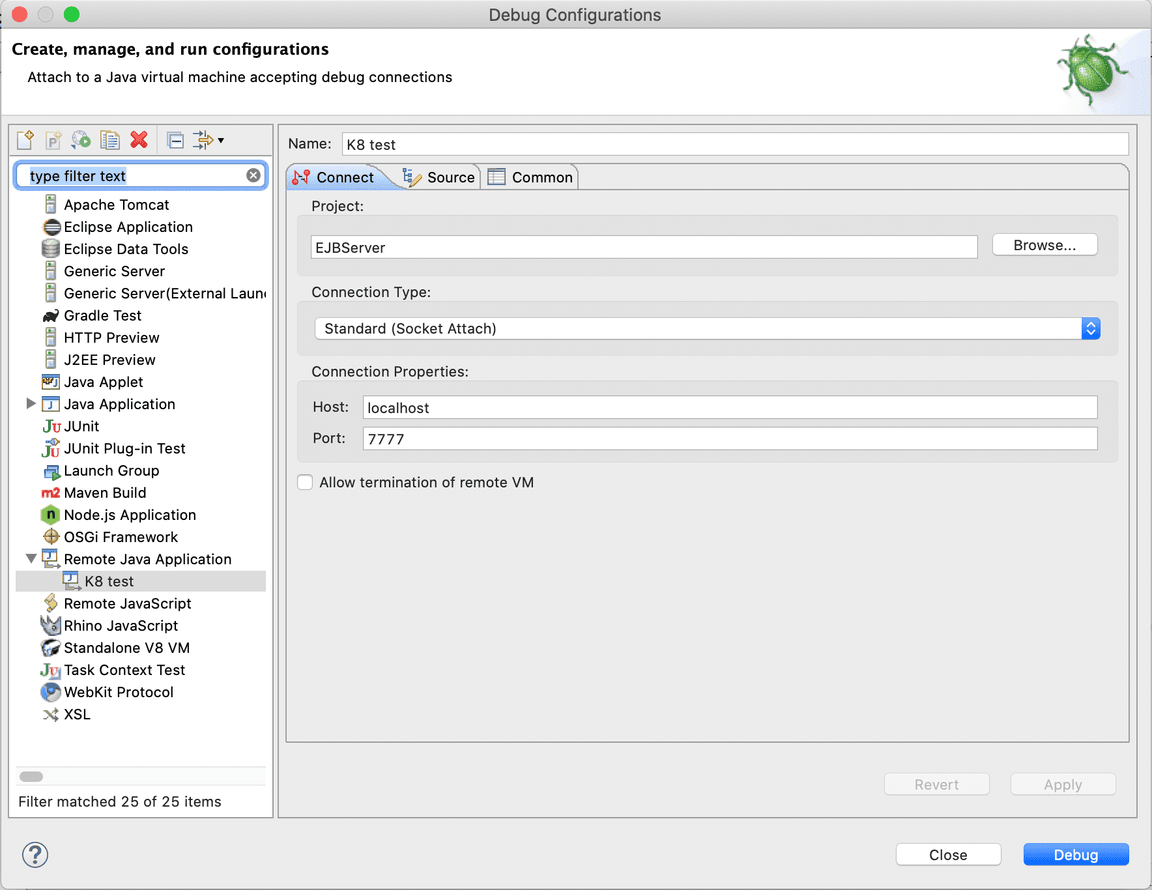
From the Eclipse debug view, create a Java Remote Application. Attach an appropriate source code project, and attach the Java Remote Application to the port you forwarded in Forward the debugging port.
The Host field in the debug configuration will be localhost even if you are using a remote cluster because the port forwarding
relies on the local loopback device.

Figure 1: Example debugger config
Connect the remote debugger to the listener
Launch the debugger and debug as usual.