Logging and Monitoring
You can monitor status or troubleshoot issues with your installation in the following ways:
- View the ACD logs by configuring a logging dashboard
- View pod status and logs
- Log in to a pod to investigate its status
- Enabling ACD prometheus metrics
Configuring a logging dashboard
OpenShift supports many solutions for collection and visualization of logs. Below are several examples that illustrate the views required for monitoring and debugging ACD deployments.
A note about tenant and correlation identifiers in ACD logs
ACD outputs its log entries as JSON objects. Of special note within the JSON structure is the “mdc” object which generally contains two keys.
- correlationId: a UUID used to correlate all log entries for an ACD invocation across all annotators. This can be helpful in performing root cause analysis when problems occur.
- tenantId: The unique identifier for a specific tenant if ACD is being utilized in a multi-tenant manner. In a single tenant environment it will always be “defaultTenant”.
Using the OpenShift cluster logging operator
The OpenShift cluster logging operator allows for deploying an Elasticsearch, Fluentd, Kibana (EFK) stack to collect and visualize logs from applications. Due to the preconfigured nature of the EFK components, the sample views for ACD are limited to basic string queries using Kibana’s Lucene query syntax. For instructions on setting up the logging operator itself, see the OpenShift documentation for your OpenShift release.
| View | Lucene Query |
|---|---|
| All ACD logs | kubernetes.container_name:merative-acd-* |
| All non-status API calls | kubernetes.container_name:"merative-acd-acd" AND "api_time" NOT "\"resource\"\:\"status\"" |
| ALL Analyze API calls | kubernetes.container_name:"merative-acd-acd" AND "\"resource\":\"analyze\"" AND "\"api_verb\":\"POST\"" |
| ACD 5XX responses | kubernetes.container_name:"merative-acd-acd" AND "\"api_rc\":500" OR "\"api_rc\"\:501" OR "\"api_rc\"\:503" OR "\"api_rc\"\:504" |
| ACD 4XX responses (user errors) | kubernetes.container_name:"merative-acd-acd" AND "\"api_rc\":400" OR "\"api_rc\"\:403" OR "\"api_rc\"\:404" OR "\"api_rc\"\:409" OR "\"api_rc\"\:413" |
| ACD runtime exceptions | kubernetes.container_name:"merative-acd-*" AND exception |
- To filter out logs for automated verification testing that occurs during pod startup, add
NOT "\"correlationId\"\:\"junit-*"to the query string. - If your cluster contains multiple deployments of ACD in different namespaces, add
AND kubernetes.namespace_name:"<namespace>"to view the logs for only one deployment. - To view logs filtered by correlationId, include
"\"correlationId\":\"<correlation_id>\"". - In a multi-tenant ACD deployment, add
"\"tenantId\":\"<tenant_id>\""to see only log entries related to a specific tenant.
Enabling JSON logging for OpenShift Container Platform
Prerequisites
- Access to Red Hat OpenShift Container Platform
- In your OpenShift project, make sure that you install below operators: a. Red Hat OpenShift logging operator b. OpenShift Elasticsearch operator
Logs including JSON logs are usually represented as a string inside the message field. That makes it hard for users to query specific fields inside a JSON document. OpenShift Logging’s Log Forwarding API enables you to parse JSON logs into a structured object and forward them to either OpenShift Logging-managed Elasticsearch or any other third-party system supported by the Log Forwarding API
You need to ensure that the OpenShift Logging Operator can parse the JSON data correctly. JSON parsing is possible as of version 5.1 of this operator. You only need to deploy a custom ClusterLogForwarder resource. This will overwrite the Fluentd pods and provide the configuration needed to parse JSON logs. Log in to your OpenShift platform to create cluster log forwarder as shown below:

As shown in the above image, once you choose to create Cluster Log Forwarder, select the yaml view radio button and paste the below configuration:
apiVersion: logging.openshift.io/v1kind: ClusterLogForwardermetadata:name: instancenamespace: openshift-loggingspec:outputDefaults:elasticsearch:structuredTypeKey: kubernetes.labels.app_kubernetes_io/part-of
structuredTypeKey (string, optional)is the name of a message field. The value of that field, if present, is used to construct the index name.- The value of
structuredTypeKeyprefixes with “kubernetes.labels.key”. In this case, the value of “key” is “app_kubernetes_io/part-of”. - In the above snippet of code, we are making use of
structuredTypeKeyto create index in Kibana. The new index will be created as “app-{app_kubernetes_io/part-of}“. - In the above case, the value of “app_kubernetes_io/part-of” is “merative-acd”. The index will be created as “app-merative-acd”.
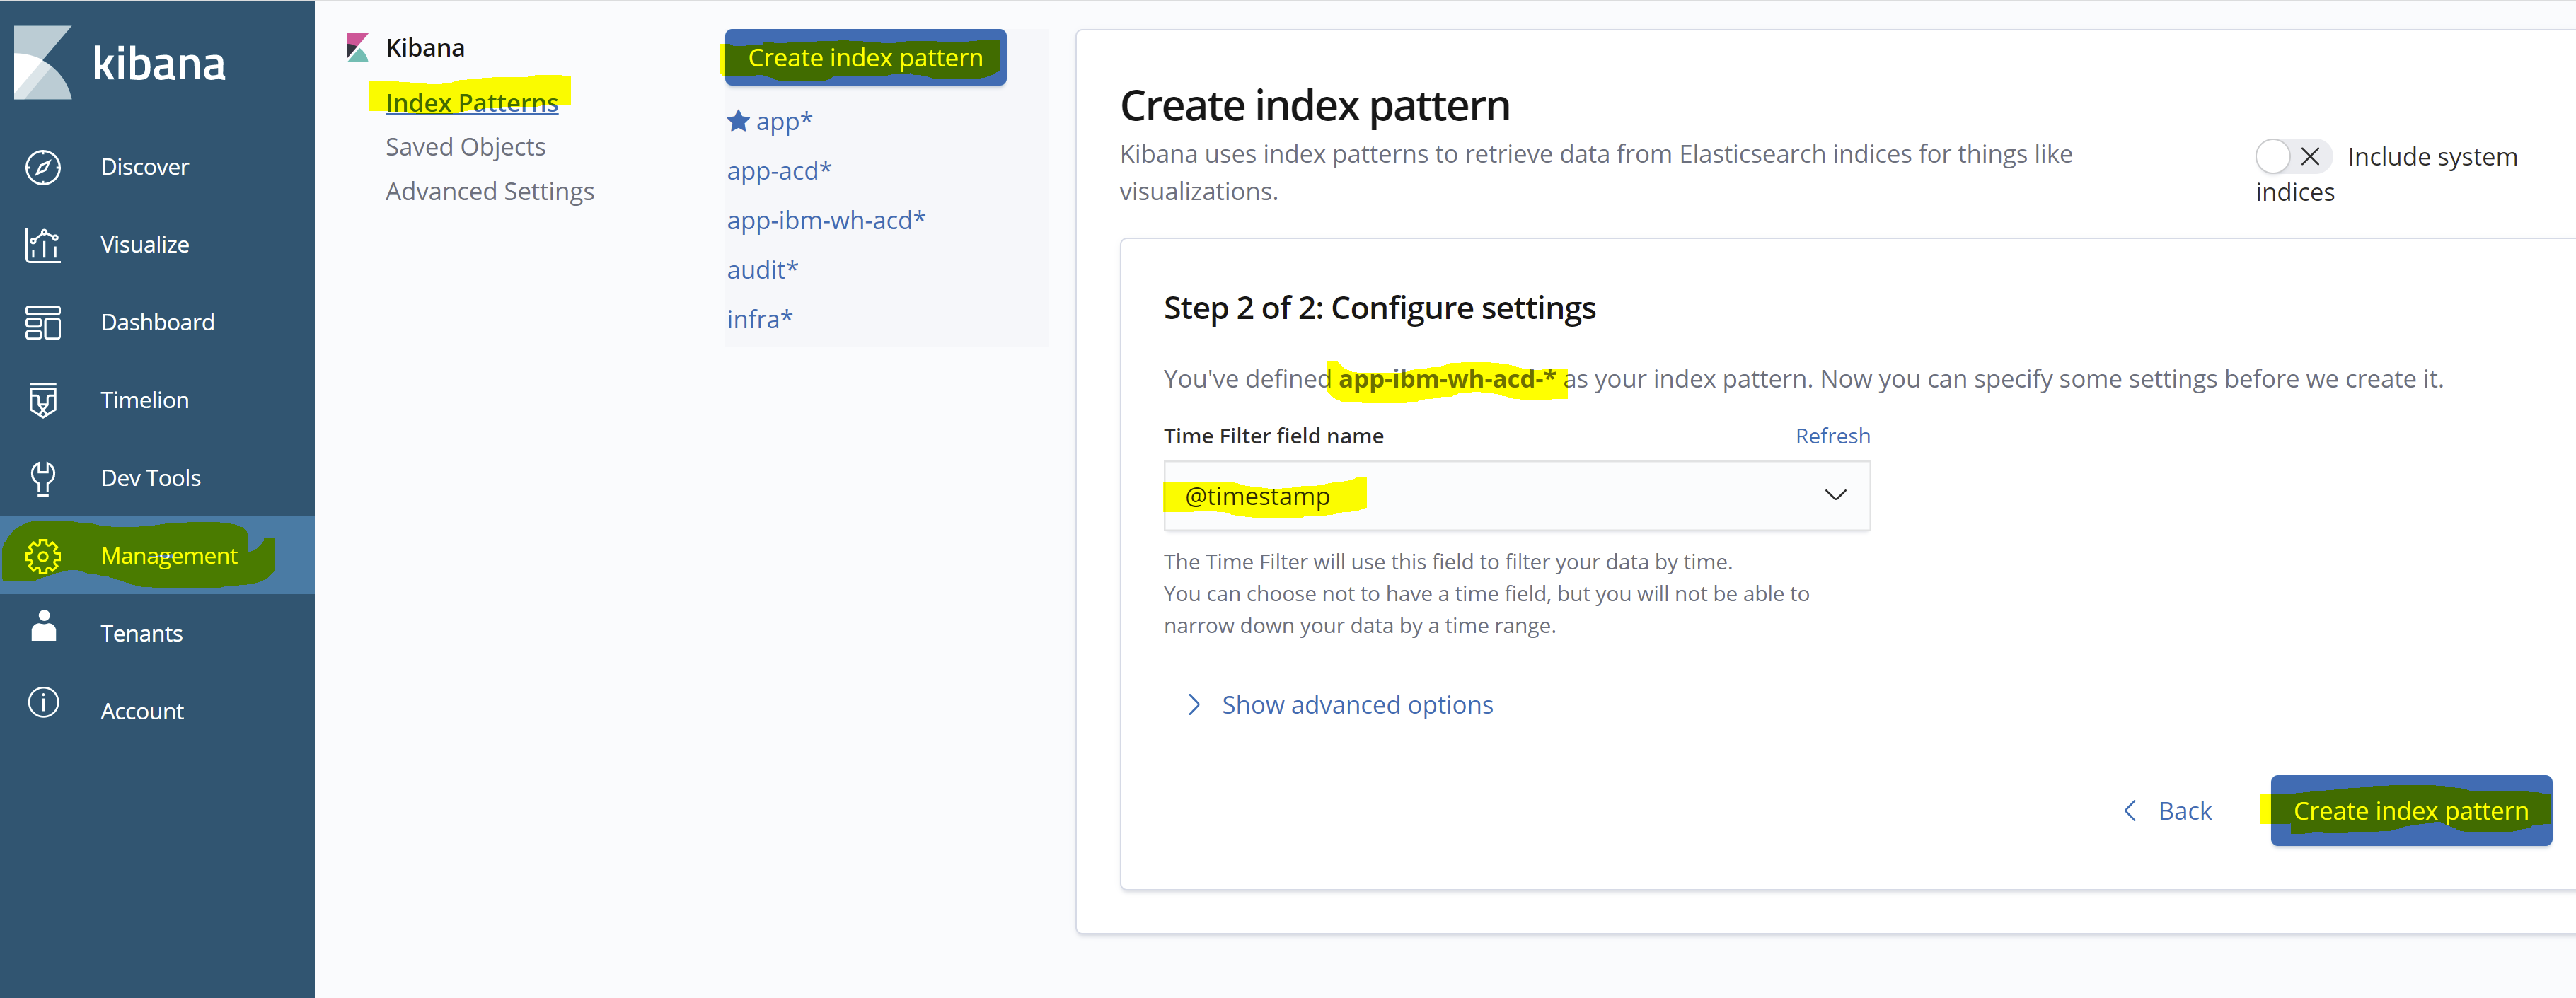
- Once the new index is created using the Custom Log Forwarder, log in to Kibana and create the index pattern with the name matching as “app-merative-acd-*” as shown below:

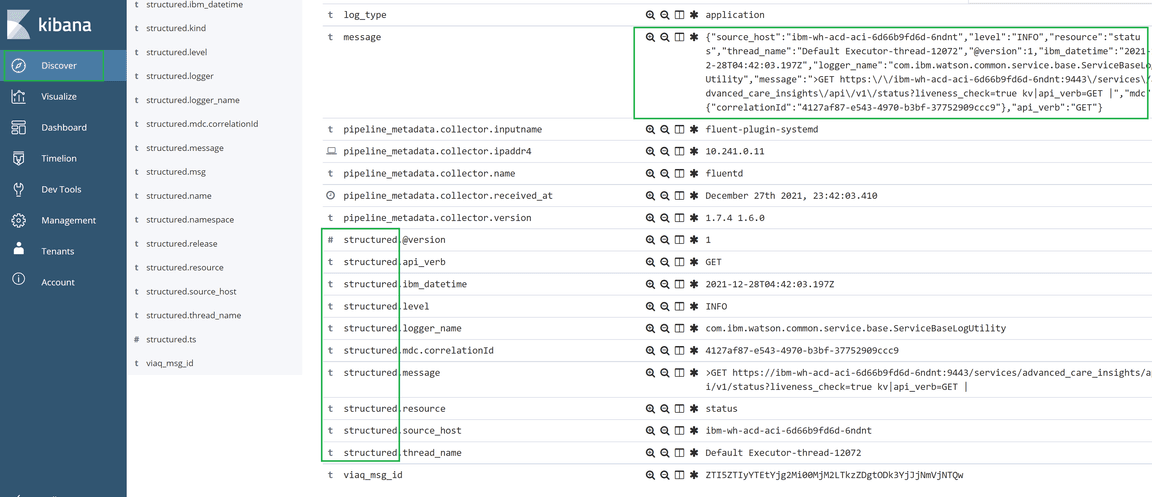
- Once you browse to the discover screen, select the index pattern you created above and you will be able to find the logs inside message fields coverted to JSON prefixed as “structured” fields as shown in below:

- As the logs are now converted to JSON, you can use the fields in the visualizations/dashboards as per the requirement.
- Here is the Custom Dashboard that can be useful to analyze your data:
[{"_id": "1bc00b00-72f4-11ec-8b80-f979ac279214","_type": "dashboard","_source": {"title": "ACD CE Dashboard","hits": 0,"description": "","panelsJSON": "[{\"gridData\":{\"x\":0,\"y\":0,\"w\":24,\"h\":15,\"i\":\"1\"},\"version\":\"6.8.1\",\"panelIndex\":\"1\",\"type\":\"visualization\",\"id\":\"41c2c050-5782-11ec-b7f6-83b6c3cdab1d\",\"embeddableConfig\":{}},{\"gridData\":{\"x\":24,\"y\":0,\"w\":24,\"h\":15,\"i\":\"2\"},\"version\":\"6.8.1\",\"panelIndex\":\"2\",\"type\":\"visualization\",\"id\":\"4273e080-5785-11ec-b7f6-83b6c3cdab1d\",\"embeddableConfig\":{}},{\"gridData\":{\"x\":0,\"y\":15,\"w\":24,\"h\":15,\"i\":\"3\"},\"version\":\"6.8.1\",\"panelIndex\":\"3\",\"type\":\"visualization\",\"id\":\"3197dbc0-5787-11ec-b7f6-83b6c3cdab1d\",\"embeddableConfig\":{}},{\"gridData\":{\"x\":24,\"y\":15,\"w\":24,\"h\":15,\"i\":\"4\"},\"version\":\"6.8.1\",\"panelIndex\":\"4\",\"type\":\"visualization\",\"id\":\"a735b160-578a-11ec-b7f6-83b6c3cdab1d\",\"embeddableConfig\":{}},{\"gridData\":{\"x\":0,\"y\":30,\"w\":24,\"h\":15,\"i\":\"5\"},\"version\":\"6.8.1\",\"panelIndex\":\"5\",\"type\":\"visualization\",\"id\":\"050ed340-5784-11ec-b7f6-83b6c3cdab1d\",\"embeddableConfig\":{}}]",
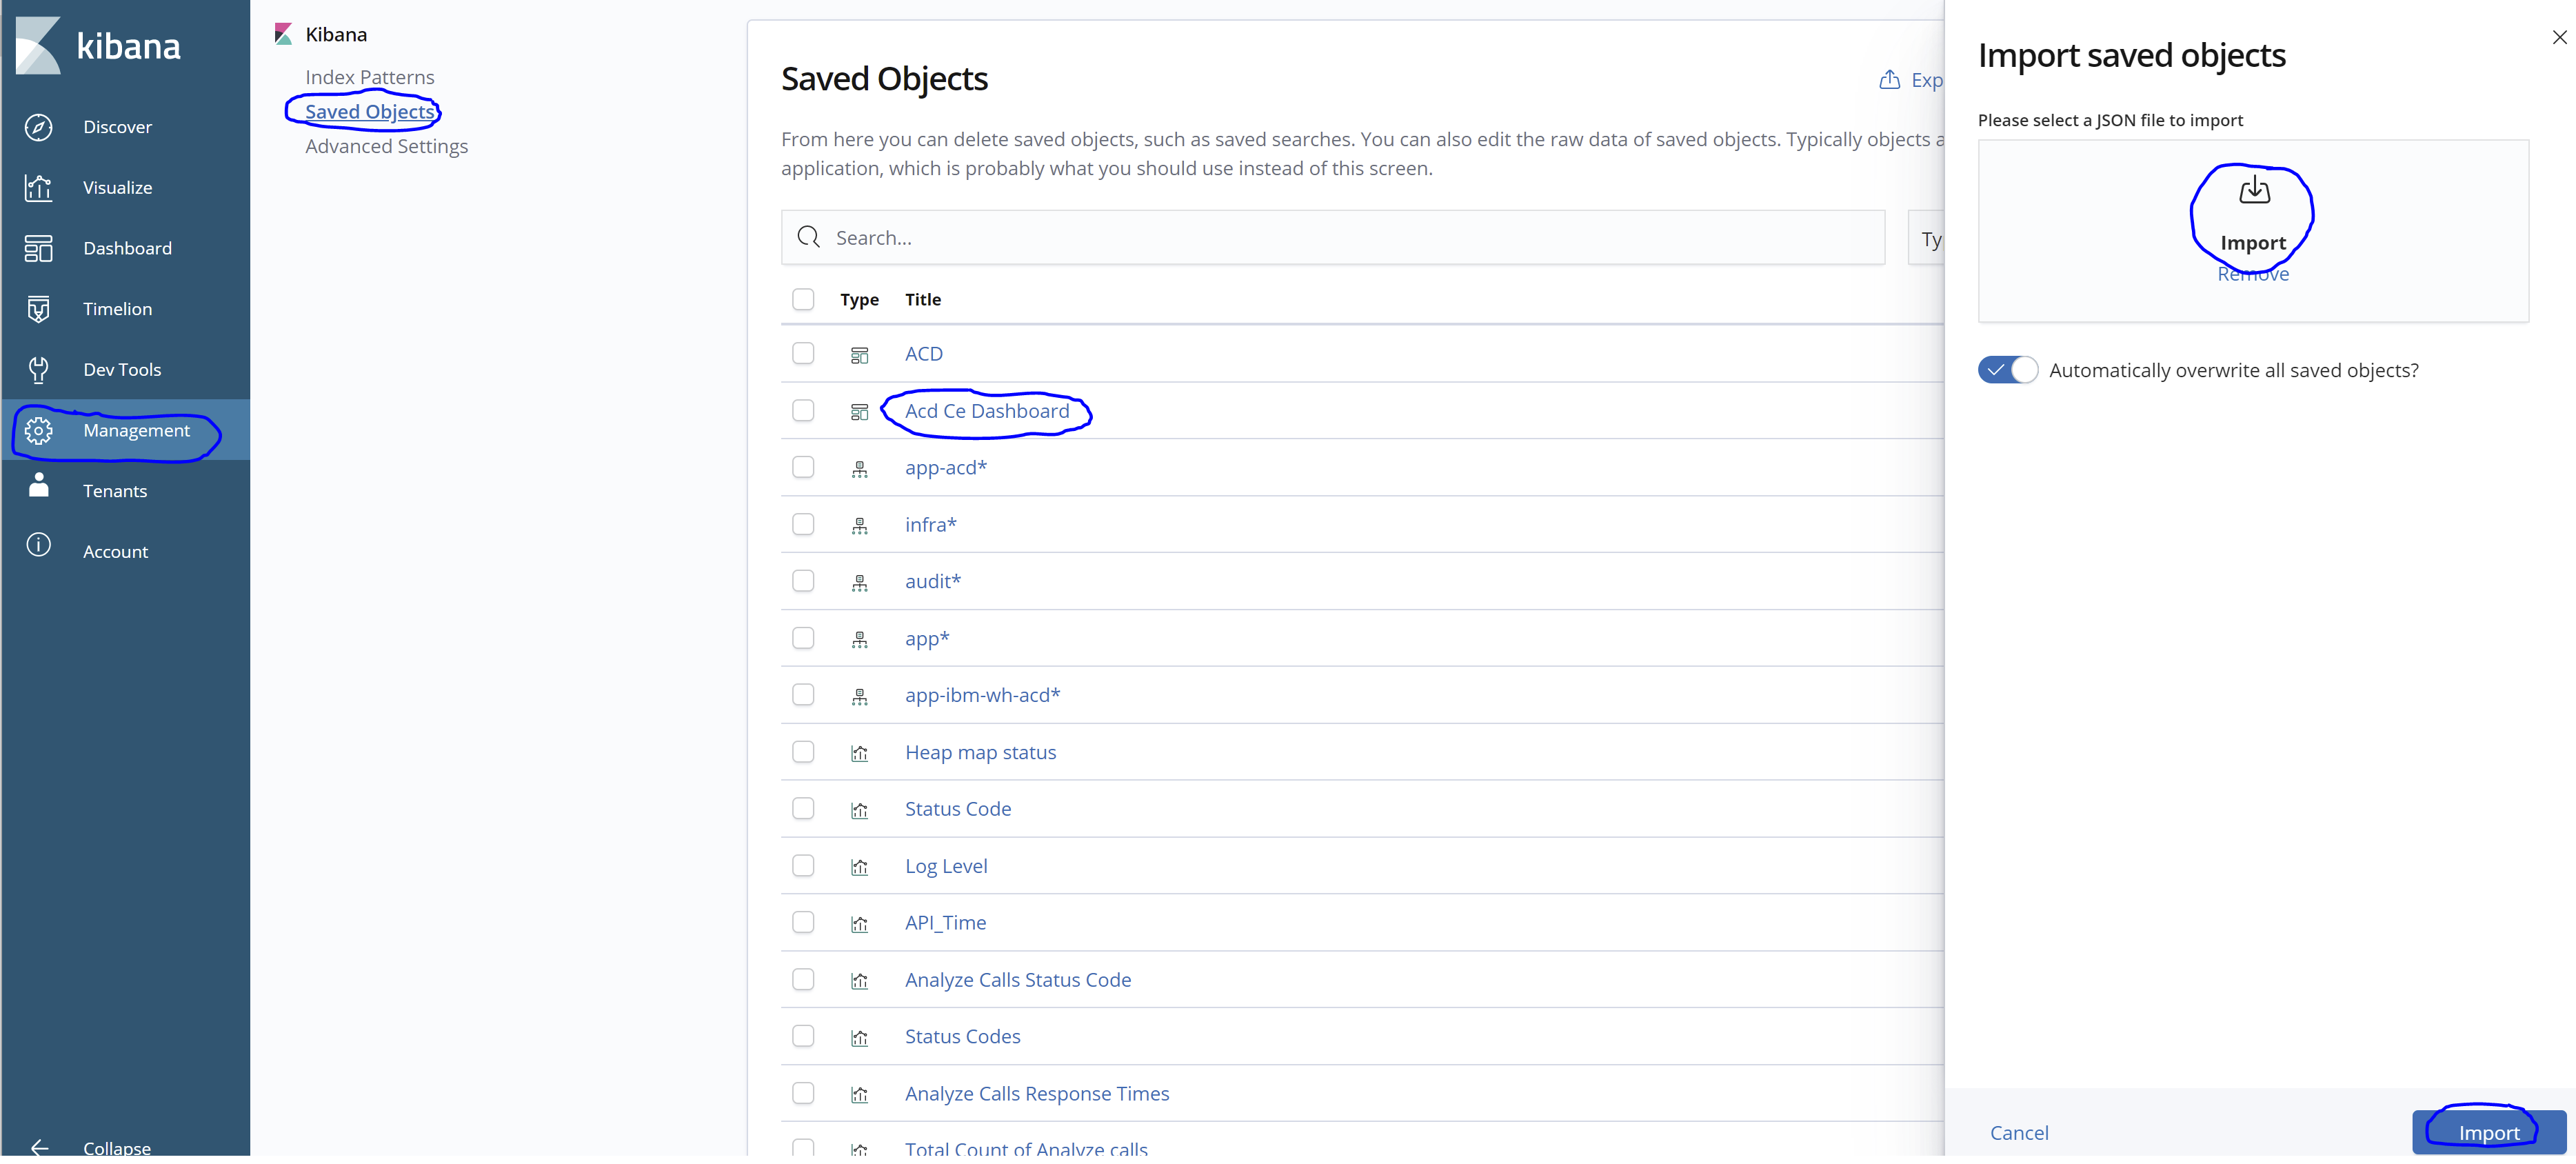
Import the ACD CE dashboard as shown below: 
Using IBM Log Analysis on a Red Hat OpenShift on IBM Cloud Cluster (ROKS)
A ROKS cluster can be configured to automatically forward cluster to logs to an instance of the IBM Log Analysis service in the same IBM Cloud account. Instructions for setup can be found in the logging topic of the ROKS documentation. Once logs are being collected, create the following views for ACD:
| View | Log Analysis Query |
|---|---|
| All ACD logs | app:merative-acd |
| All non-status API calls | app:merative-acd api_time:* -resource:status |
| ALL Analyze API calls | app:merative-acd-acd resource:ANALYZE api_verb:POST |
| ACD 5XX Responses | app:merative-acd api_rc:>499 |
| ACD 4XX Responses (user errors) | app:merative-acd api_rc:>399 api_rc:<500 |
| ACD runtime exceptions | app:merative-acd exception |
- To filter out logs for automated verification testing that occurs during pod startup, add
-mdc.correlationId:junitto the query string. - If your cluster contains multiple deployments of ACD in different namespaces, add
namespace:<namespace>to view the logs for only one deployment. - To view logs filtered by correlationId, include
mdc.correlationId:<correlation_id>. - In a multi-tenant ACD deployment, add
mdc.tenantId:<tenant_id>to see only log entries related to a specific tenant.
Other logging solutions
Other log collection and visualization solutions may be used as long as they can be configured with similar views as described above. This includes native log solutions in supported clouds as well as forwarding to an external log aggregator using the OpenShift Cluster Logging Operator’s log forwarding support
View pod status and logs
All OpenShift objects can also be accessed by running the oc command-line tool.
To list the objects, run the oc get command followed by the types of object to retrieve, for example: pods, services, deployments, or secrets. A useful option is the -w (watch) option. The watch option keeps the command in a pending state, showing how the pods change over time. It also follows the pods through the initialization, waiting, and running phases.
An example of oc get, to list the names and status of the pods in the specified namespace:
oc get pods -w -n ${acd_namespace}
When a pod is running, you can read the log of that pod by running the following command:
oc logs <pod-name> -n ${acd_namespace} where pod-name is the name of the pod you want to query.
You can use the -f (follow) option to leave the command open and show the log updating in real time.
Log in to a pod
Like any other Docker container, when a pod is in running status, you can log in to it to conduct a more detailed investigation. The commands that you use depend on the pod, but the following command should work because bash is generally available:
kubectl exec -it <pod-name> -n ${acd_namespace} /bin/bash
The command opens a bash session within the pod.
Enabling and Configuring ACD prometheus metrics
ACD provides various prometheus metrics to help monitor ACD requests.
OpenShift user-defined monitoring must be enabled as a prerequisite to gather ACD metrics.
Read OpenShift monitoring overview
Enable OpenShift user-defined monitoring in the ACD namespace
ACD itself is configured to provide metrics by default. OpenShift will collect these metrics when user-defined monitoring is enabled as described in the previous steps.
Modifying the prometheus configuration for an ACD instance.
- The promethus configuration for an ACD instance can be modified by editing the PodMonitor resource in the ACD namespace. The polling interval is the most likely parameter to be changed. Prometheus metrics gathering of a specific ACD instance can also be disabled by deleting the PodMonitor resource in that namespace.
- NOTE: You must change the prometheus.createPodMonitor parameter in the ACD operator yaml instance to false before the PodMonitor object can be modified or deleted. This will not delete the PodMonitor resource if it already exists.
- Example prometheus config section in the Acd resource instance yaml:"prometheus": {"createPodMonitor": false,"scrape": true},
- The ACD PodMonitor resource can be edited from the OpenShift UI by searching for the PodMonitor resource in the namespace where ACD is installed.
- Example default ACD PodMonitor configurationapiVersion: monitoring.coreos.com/v1kind: PodMonitormetadata:name: merative-acd-prometheus-monitornamespace: <acd namespace>labels:app.kubernetes.io/instance: merative-acd-prometheus-monitor-acd-instanceapp.kubernetes.io/name: merative-acd-prometheus-monitorapp.kubernetes.io/part-of: merative-acd
ACD Metrics
| Metric Name | Type | Description |
|---|---|---|
| clinical_data_annotator_api_calls_count_total | Counter | The total number of API requests. |
| clinical_data_annotator_api_time_seconds | Gauge | The time of an API request in seconds. |
| clinical_data_annotator_api_request_size_bytes | Gauge | The size of the API request in characters. |
| clinical_data_annotator_api_concurrency_count | Gauge | The number of concurrent API requests. |
| clinical_data_annotator_api_queued_time_seconds | Gauge | The queued time of an API request in seconds. |
Note: The labels available for each metric can be displayed by running a query on just the metric name.
Example prometheus ACD queries
Monitor ACD metrics from the OpenShift web console using Observe -> Metrics or your custom Prometheus or Grafana application.
- Request rate by pod (requests per second, 5 minute sample)sum by(pod)(rate(clinical_data_annotator_api_calls_count_total[5m]))
- Request rate by pod with namespace filter. Use this filter if you have multiple instances of ACD installed.sum by (pod)(rate(clinical_data_annotator_api_calls_count_total{namespace="merative-acd-operator-system"}[5m]))
- Total request ratesum(rate(clinical_data_annotator_api_calls_count_total[5m]))
- Average request sizeavg(clinical_data_annotator_api_request_size_bytes)
- Total request sizesum(clinical_data_annotator_api_request_size_bytes)
- Concurrent requests by podsum by(pod)(clinical_data_annotator_api_concurrency_count)
- Total concurrent requestssum(clinical_data_annotator_api_concurrency_count)
- Response count by return codesum by (acd_api_rc)(clinical_data_annotator_api_calls_count_total)
- Total response count with 5xx return codessum by (acd_api_rc)(clinical_data_annotator_api_calls_count_total{acd_api_rc=~"5.."})
- Average response time by uriavg by (acd_api_resource)(clinical_data_annotator_api_time_seconds)